Fab things which could be done with InfluxDB & Grafana
Learn what’s InfluxDB?
InfluxDB is nothing new but a database, which is a time series database platform. Its built to handle massive countless time-stamped entires stored at a place. Which can store infrastructure, applications and sensors data entires.
Wondering, why influxDB?? instead of other databases available in market like mySQL, PostgreSQL, Microsoft SQL Server, MongoDB etc. The answer to it is, influxDB is very light weight, simple and the best part of the database is that it could be used directly by making raw https requests.
Installation of influxDB on MacOS
- Install InfluxDB service on your system
brew update
brew install influxdb
For other operating systems you may refer this link: Installation links
Note: Default port used by influxDB is 8086
- Start the service on your MacOS
brew services start influxdb- Now, let’s jump inside the influxDB
➜  ~ influx
Connected to http://localhost:8086 version 1.8.2
InfluxDB shell version: 1.8.2- Stopping the InfluxDB service is easy.
brew services stop influxdbConcepts and terminologies used in InfluxDB
Database
A database is a container (place) for storing information, with time series data incase of influxDB. How do we create a database? It’s simple
create database grocceryTo list the created databases:
show databasesFields
Fields are actually the columns in a measurement. It’s a key-value pair, includes storing of fields in the field column and values in the values column. Fields aren’t indexed, hence while using a query for values which do not vary & not part of where clause are generally stored as fields in a table.
Tags
Tags in general term are fields which are indexed when created. And allows better quering and filtering of data in a measurement.
Measurement
It’s a combination of fields and tags which together creates a measurement (table).It’s a part wherein we can store data in associated fields in influxDB.
Before creating a measurement we need to use the database within which a measurement (table) would be created. So let’s first use the database
> use groccery
Using database groccery
Now, create a measurement with fields and tags forming its structure. Let us insert multiple records in the measurement.
insert fruits,category=pome,type=apple value=10
insert fruits,category=citrus,type=orange value=5
insert fruits,category=stone,type=cherries value=15
insert fruits,category=pome,type=pears value=25
Fruits here is a measurement, which contains category, type as tags and value being the field. Let’s execute the query to see all the inserted records under the fruits measurement:
> select * from fruits
name: fruits
time                category type     value
----                -------- ----     -----
1606373405724568000 pome     apple    10
1606373527398317000 citrus   orange   5
1606373532126017000 stone    cherries 15
1606373542271729000 pome     pears    25
For more details on InfluxDb, you may refer this link
What’s Grafana?
It’s a visualization dashboard, which allows you to plot interactive and dynamic graphs. It provides plotting of data in different forms like, graphs, charts, alerts etc.
You can plot beautiful graphs with time-series data, which is the exact requirement fulfilled by InfluxDB.
Install Grafana on MacOS
- Install Grafana service on your system
brew update
brew install grafana
Links for installing grafana on other operating systems are here
- Start the Grafana service using command
➜  ~ brew services start grafana
Service `grafana` already started, use `brew services restart grafana` to restart.
Note: Default port used by grafana is 3000 and the standard username/password after installation is admin/admin. Password can be changed after logging into the system
- Access ”http://localhost:3000/login” and login with admin/admin credentials.
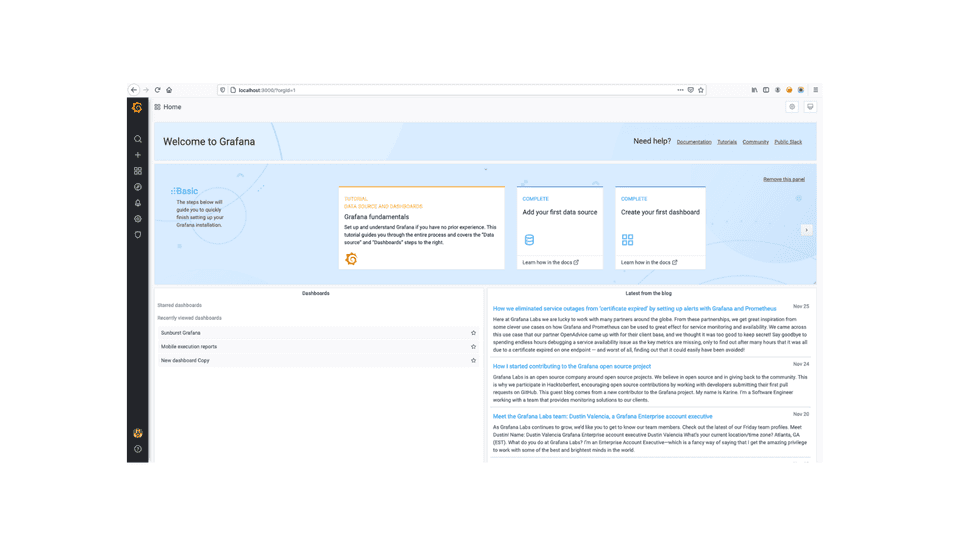
Here’s the first glance of the Grafana dashboard

- Stopping the Grafana service is simple too
brew services stop grafanaQuering and building dashboards within Grafana
Firstly, we need to connect the data-source which would provide us the data to plot dynamic graphs. Let’s proceed with the steps required to connect InfluxDB with Grafana.
- Start the influxDB service
- Start the grafana service
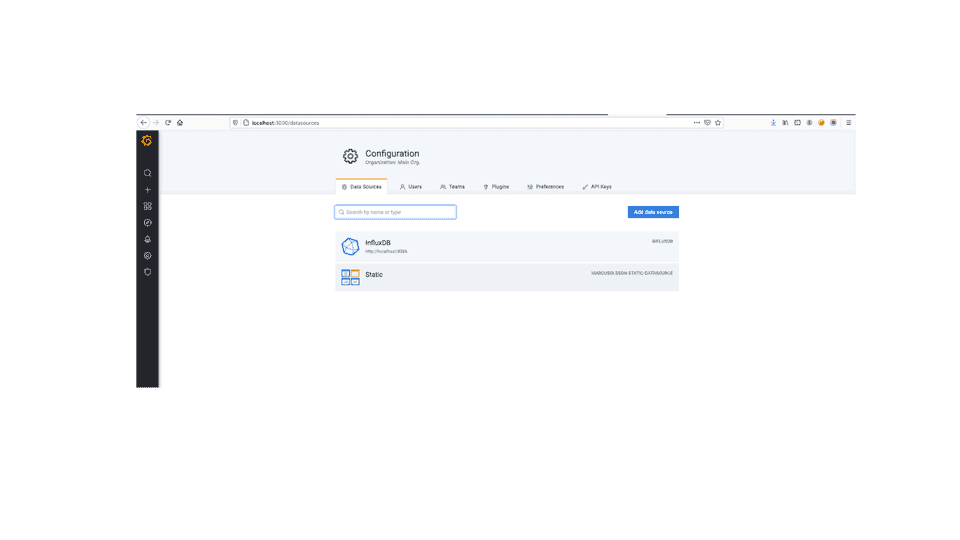
- Login to grafana dashboard and move to datasource section.
There are couple of datasources which are provided by Grafana i.e:
- Prometheus
- Graphite
- Open TSDB
- InfluxDB and many more
We would use InfluxDB, hence choose datasource as Influx add the required details regarding database, save the settings and success message should be shown.
Data source is working
- Now proceed creating a dashboard which would display the data related to a application or a system.
- Create a new dashboard, access the settings icon to rename it as Grocerry Reports
- Create a panel within the Dashboard, access the datasource and query the data as follows:
In-order to get hands On, let’s create 2 panels
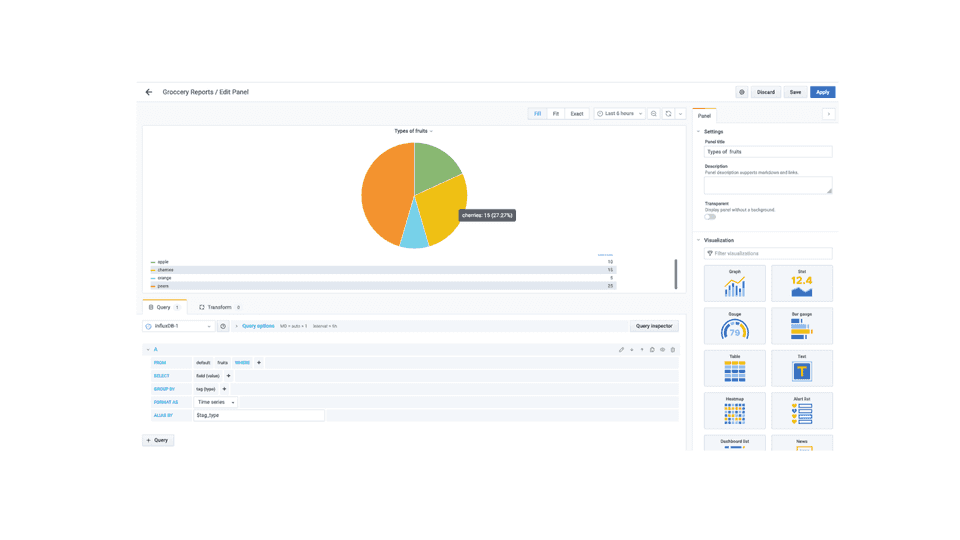
- Types of fruits which will be a pie chart, whose query would be something like
SELECT "value" FROM "fruits" WHERE $timeFilter GROUP BY "type"
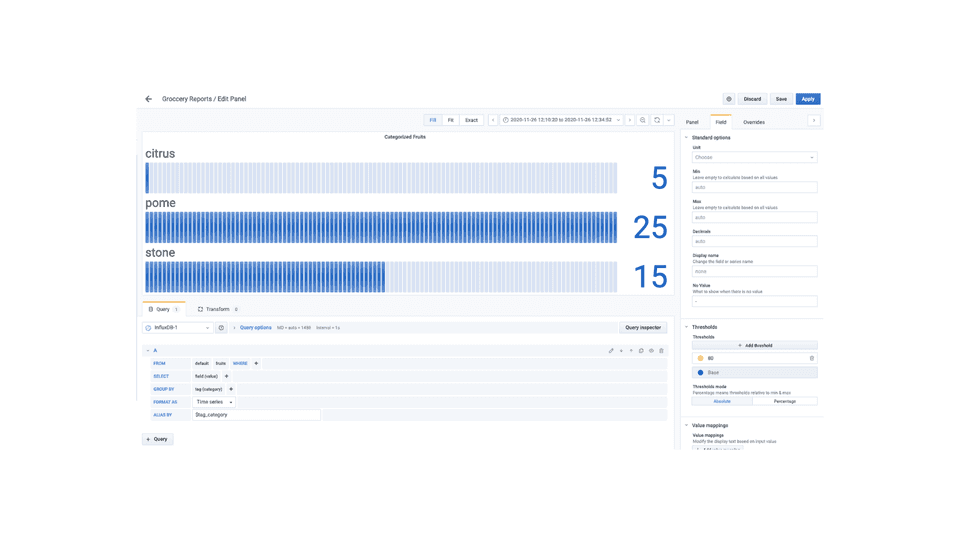
- Categorize fruits in terms of citrus, pome & stone which would be a bar guage representation, with query
SELECT "value" FROM "fruits" WHERE $timeFilter GROUP BY "category"
That’s about it! I may have missed few things here for sure.
Connect with me at dikshitashirodkar25@gmail.com, If you would like to know more, or comment down here :)